 Just a 46-year-old mom of 2 in Northern California. My kids are Monkey Monkey(MM) and Drama Llama (DL). I am married to Monkey Hubby (MH).
http://money.cnn.com/galleries/2007/pf/0702/gallery.median_i...
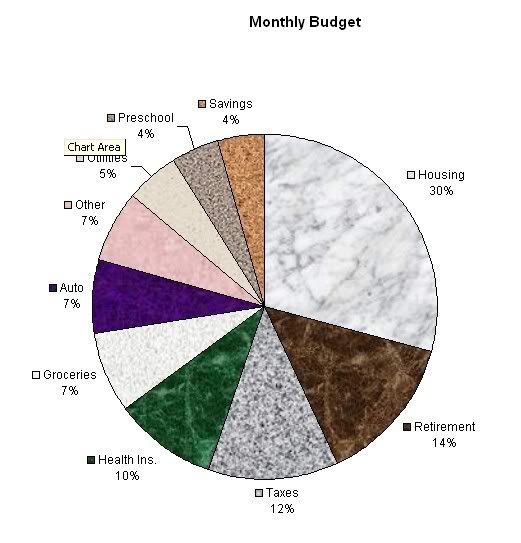
I don't know why, but looking at this article made me want to make a pie chart of my own - LOL. I play with percentages a lot, but never thought to put in chart form. I played with excel and figured it out pretty quickly (learned how in college, haven't done a pie chart since I believe - LOL).
Anyway, I cam up with this.

I think it's perty. Some things to note, housing includes the gardener and other maintenance. Not all fixed expenses. Haven't had the gardener long and would be the first thing to go if needed. I am impressed with the auto percentage - gas, insurane and budgeted maintenance on 2 cars. No payments (as of last week!). I laughed at the thread in the forums about the 8yo car with 85k miles. I think dh's car is 6yo with 65k miles and I figure it has a decade left in it, easily. I still consider it brand new, but I guess for me it is pretty new. But though we don't plan to replace either car soon, most of our 4% savings (and interest it earns) is earmarked for future car purchses, so you could consider our car % at 10% or so (7% + 3% - most of savings).
It surprised me what a chunk our taxes are since we pay so little in income taxes these days, but most of it is social security/payroll taxes (about 8%). I put the property taxes (& insurance & HOA and all that) with the house.
"Other" is all of our other insurances, gifts, donations, medical co-pays (can get pricey), subscriptions, clothing, our allowance (I should have put that in - it's about 1.4% of all expenses for our own splurges). We rarely have enough for ALL this stuff, but I based this graph on my wage alone. Making extra money on the side helps us to find money for all this stuff which we could otherwise live without I guess. Well, ideally we like to divide extra money between the "extras" and adding more to savings.
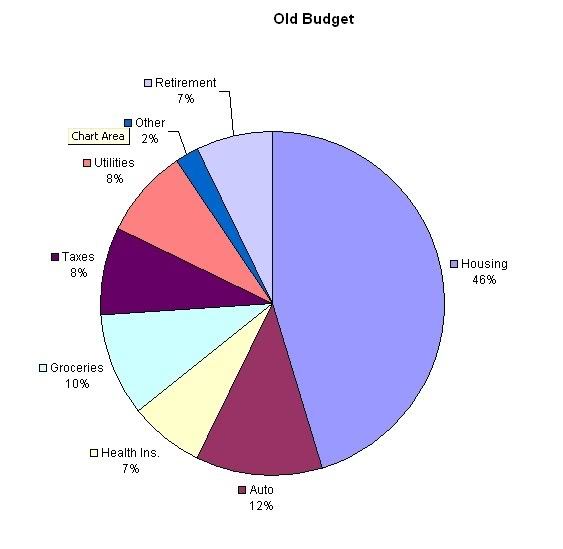
I didn't have the time to pretty up this one as much, but decided to do a graph about where we were at when we had our first child.

It's interesting how different it looks. Housing was a big chunk, but less than we thought it would ever be growing up where we did. I notice over time as our health insurance skyrockets, we shift a lot that was our mortgage % to taxes and health insurance. I expect our taxes to get pretty ugly in the future.
Today we have A LOT more for both savings and retirement. I think that is why when my dh first stopped working we looked at it as very temporary. These days I feel more and more we can do it for the long haul. I never expected to get such large raises in such a short amount of time, so we have definitely upped our lifestlyle and tried to enjoy a little as well.
I figured I would share. It is too often that people will look at someone and say, oh they had it easy. I think I get that a lot more since we have suddenly found a lot more financial comfort. Bigger wage, sudden influx from our parents, etc. But this was not what our situation is when we first made the 1-income leap. It was pretty dang tight. There were many years we never considered having cable or a gardener or the like. But with time I guess things change. I just hope all of us can say the same. With time we should all find more comfort in our life, by taking care of our finances. Slow and steady wins the race!
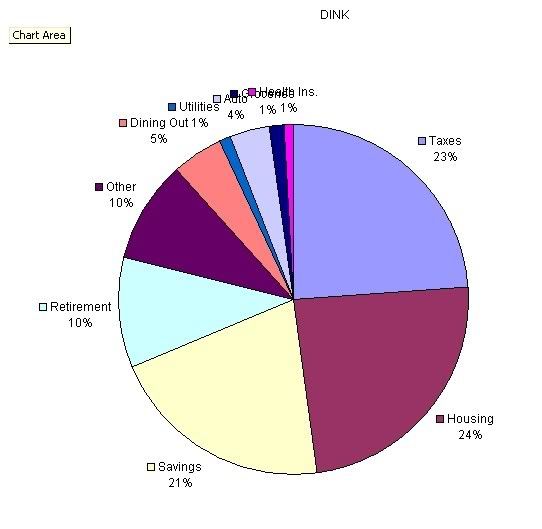
Of course I miss these days (DINK = double income no kids), but saving heavily when we could, really paid off.

Of course I'll take the kids, and added financial strain, any day...
ETA: Oh yeah - sorry I can't seem to reply to my own blog from my work computer - lord knows why. So though I tried to comment on the comments I couldn't. Please forgive me - I'll try again from home (keep forgetting).
I don't know why, but looking at this article made me want to make a pie chart of my own - LOL. I play with percentages a lot, but never thought to put in chart form. I played with excel and figured it out pretty quickly (learned how in college, haven't done a pie chart since I believe - LOL).
Anyway, I cam up with this.
I think it's perty. Some things to note, housing includes the gardener and other maintenance. Not all fixed expenses. Haven't had the gardener long and would be the first thing to go if needed. I am impressed with the auto percentage - gas, insurane and budgeted maintenance on 2 cars. No payments (as of last week!). I laughed at the thread in the forums about the 8yo car with 85k miles. I think dh's car is 6yo with 65k miles and I figure it has a decade left in it, easily. I still consider it brand new, but I guess for me it is pretty new. But though we don't plan to replace either car soon, most of our 4% savings (and interest it earns) is earmarked for future car purchses, so you could consider our car % at 10% or so (7% + 3% - most of savings).
It surprised me what a chunk our taxes are since we pay so little in income taxes these days, but most of it is social security/payroll taxes (about 8%). I put the property taxes (& insurance & HOA and all that) with the house.
"Other" is all of our other insurances, gifts, donations, medical co-pays (can get pricey), subscriptions, clothing, our allowance (I should have put that in - it's about 1.4% of all expenses for our own splurges). We rarely have enough for ALL this stuff, but I based this graph on my wage alone. Making extra money on the side helps us to find money for all this stuff which we could otherwise live without I guess. Well, ideally we like to divide extra money between the "extras" and adding more to savings.
I didn't have the time to pretty up this one as much, but decided to do a graph about where we were at when we had our first child.
It's interesting how different it looks. Housing was a big chunk, but less than we thought it would ever be growing up where we did. I notice over time as our health insurance skyrockets, we shift a lot that was our mortgage % to taxes and health insurance. I expect our taxes to get pretty ugly in the future.
Today we have A LOT more for both savings and retirement. I think that is why when my dh first stopped working we looked at it as very temporary. These days I feel more and more we can do it for the long haul. I never expected to get such large raises in such a short amount of time, so we have definitely upped our lifestlyle and tried to enjoy a little as well.
I figured I would share. It is too often that people will look at someone and say, oh they had it easy. I think I get that a lot more since we have suddenly found a lot more financial comfort. Bigger wage, sudden influx from our parents, etc. But this was not what our situation is when we first made the 1-income leap. It was pretty dang tight. There were many years we never considered having cable or a gardener or the like. But with time I guess things change. I just hope all of us can say the same. With time we should all find more comfort in our life, by taking care of our finances. Slow and steady wins the race!
Of course I miss these days (DINK = double income no kids), but saving heavily when we could, really paid off.
Of course I'll take the kids, and added financial strain, any day...
ETA: Oh yeah - sorry I can't seem to reply to my own blog from my work computer - lord knows why. So though I tried to comment on the comments I couldn't. Please forgive me - I'll try again from home (keep forgetting).
April 24th, 2007 at 05:08 pm 1177434513
April 24th, 2007 at 05:17 pm 1177435069
April 25th, 2007 at 04:50 am 1177476642
April 25th, 2007 at 02:55 pm 1177512905
Now i will experiment!